Description:
Data Storytelling – JMC 309 Final Project
Navigating parking on a bustling university campus can be tricky, especially for freshmen unfamiliar with the specific rules and common pitfalls. Our project, “A Freshman’s Guide to KU Parking,” offers comprehensive insights to help new students at the University of Kansas decipher where to park and what to avoid. By analyzing citation data from KU Parking and Transportation, we have provided key information like the most cited parking lots, most common citation days, and the reasons behind parking violations, giving freshmen a head start in avoiding costly tickets. Whether it’s discovering the hotspots for fines or understanding citation status, this guidebook will keep students informed and save them valuable time and money.
About This Project:
Objective and Audience:
The objective of this project was to explore and organize KU Parking and Transportation data from September to create a useful and visually engaging guide for future KU freshmen. We aimed to help new students navigate the often confusing parking situation on campus and provide them with actionable insights on which lots to avoid, what violations are common, and which days are ticket-heavy.
Target Audience:
Our primary target audience is future KU students. With this guidebook, they will be equipped with vital knowledge about the most common lots for citations, days when parking enforcement is strict, and what violations to be particularly cautious of.
Key Questions and Insights:
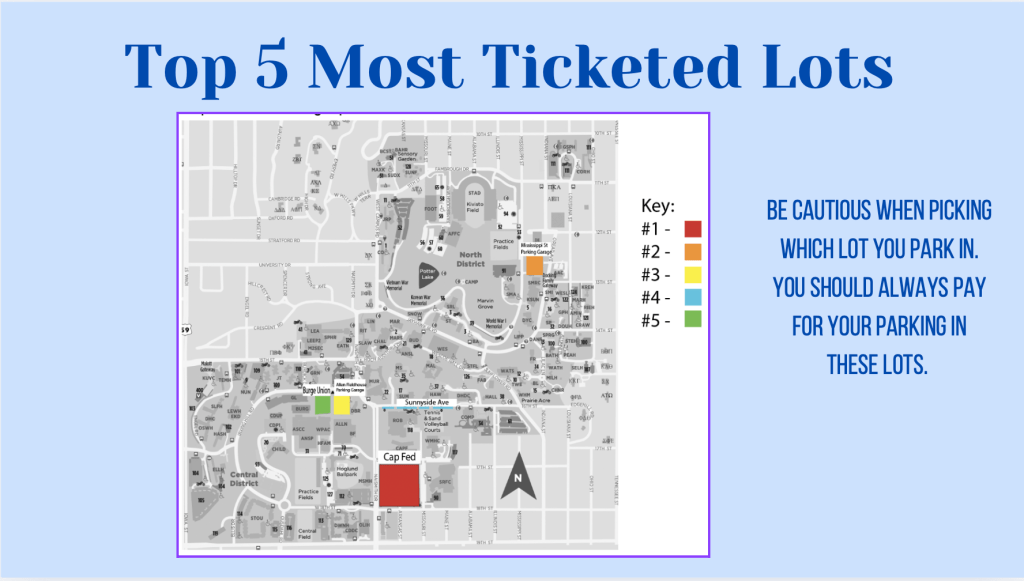
- What is the most popular lot for citations?
- Are tickets generally paid, voided/appealed, or unpaid?
- What day is the peak citation day?
- What is the cost breakdown for each citation type?
- What are the main reasons people receive parking violations?
Public Links:
- Data: Explore the Data Story
- Freshman’s Guidebook Slides: Check Out the Visuals
- KU Transportation Services: Official Website
Data Lifecycle Reflection (LOST AIs):
Locate:
We located our dataset in a class module on Canvas, specifically the KU Parking and Transportation data sheet. Additional information was gathered from the KU Transportation Services website for citation pricing.
Obtain:
The dataset was obtained directly from the class module and supplemented with public information on citation costs via the official transportation website.
Scrub:
To clean the dataset, we filtered out non-relevant columns and fields to focus on the most important insights. Sorting and pivot tables helped identify key trends and structure the data for analysis.
Transform:
Pivot tables and filtering allowed us to organize the data into digestible insights, such as identifying the peak citation day, citation hotspots, and common reasons for fines.
Analyze:
After data transformation, we identified and visualized critical trends, including fine amounts by citation reason, citation status (paid, voided, or unpaid), and offense severity.
Visualize:
The visualizations were managed by Lizzie, who used Flourish and Illustrator to create engaging and clear graphics representing citation trends, heatmaps of citation hotspots, and fine analysis charts.
Group Roles:
- Brynne Hippel: Analysis and interpretation of data trends, insight extraction.
- Megan Baker: Collection and organization of data, assisting with analysis.
- Elizabeth Soltis: Visualization creation and design using Flourish.
